
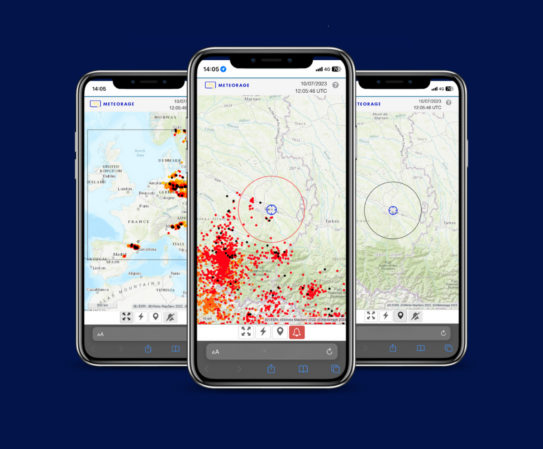
Integrate our thunderstorm and lightning map
Add live storm and lightning monitoring to your website.
The steps to follow to create your own map:
- Define the desired dimensions of the map by changing the width and height fields in the “Dimensions” box.
- Move the map with your mouse, zoom in or out according to the zone you want to display (using the + and – buttons at the top left of the map).
- Once these parameters have been defined, you can copy the text to be integrated (starting with “<iframe src”) by clicking on the “copy” button to the right of the text.
- Paste this text into the back office of your website, on the page where you want to display the map.
The map will be displayed according to the parameters you have just defined.
Dimensions
Position and zoom
Use the map to define them:
- Zoom level: 6
- Coordinates: -
Note: copy the text to be integrated by clicking on the “copy” button on the right.
Discover
our news
& resources
See all
Case study
Corporate
CSR
Events
Research
Solutions
Testimonials

Events
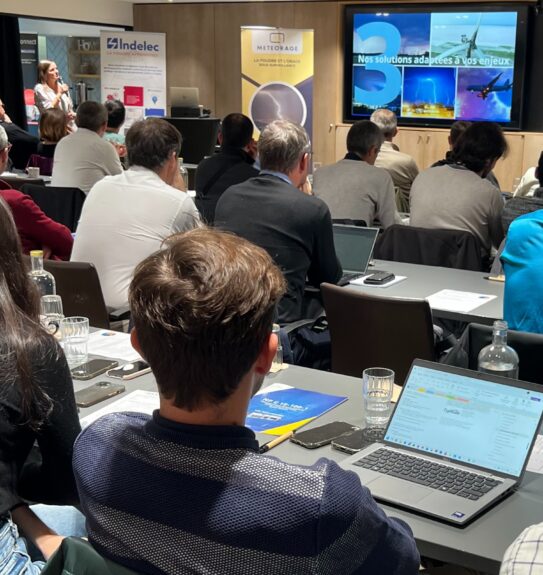
Lightning and Surge Seminars 2025
19-11-2025
Solutions
Geoflash
14-03-2025

Solutions
Optimise the maintenance of your wind turbines
14-03-2025

Testimonials
Engie Italy: lightning risk management at its wind farms
14-03-2025
Corporate
Happy NY 2025!
17-01-2025
Case study
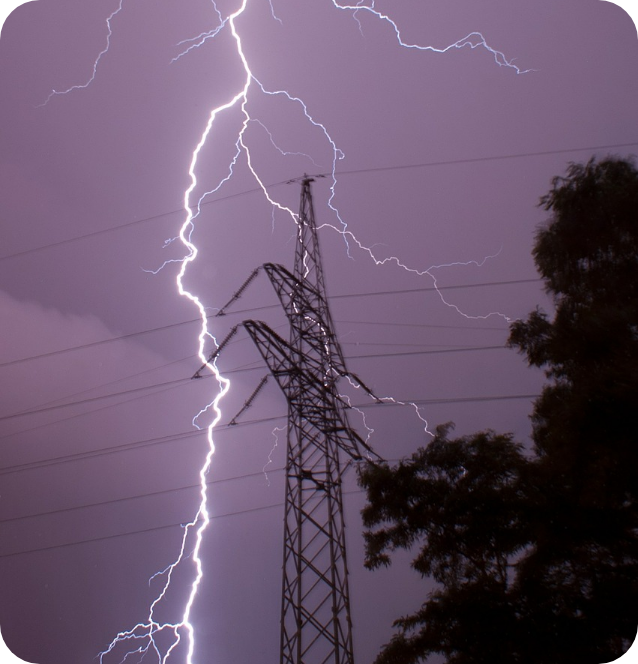
Thunderstorm episode in Spain
14-11-2024

Corporate
A new milestone!
05-10-2024

Corporate
METEORAGE at the International Meteorological Seminar
18-06-2024

Corporate
Our partnership with the South African Weather Service (SAWS)
26-04-2024

Solutions
Defence: 5 essential points to comply with DSA03-OME
12-03-2024

Corporate
Happy New Year 2024!
01-01-2024

Corporate
Tribute to Alberto Garutti
26-06-2023